Editor(s): Annabel McDermott, OT; Nicol Korner-Bitensky, PhD OT
Purpose
The Purdue Pegboard Test (PPT) is a test of fingertip dexterity and gross movement of the hand, fingers and arm in patients with impairments of the upper extremity resulting from neurological and musculoskeletal conditions.
In-Depth Review
Purpose of the measure
The Purdue Pegboard Test (PPT) was developed by Joseph Tiffin in 1948. The PPT is now used widely by clinicians and researchers as a measure of (1) gross movement of the arm, hand and fingers, and (2) fingertip dexterity. The PPT is suitable for use with patients with impairments of the upper extremity resulting from neurological and musculoskeletal conditions.
Available versions
None typically reported
Features of the measure
Description of tasks:
The PPT measures:
(1) Gross movement of the fingers, hand and arm; and
(2) Fingertip dexterity
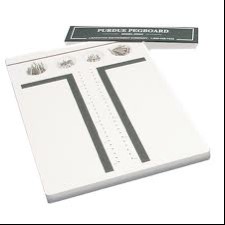
The patient should be seated comfortably at a testing table with the PPT on the table in front of him/her. The testing board consists of a board with 4 cups across the top and two vertical rows of 25 small holes down the centre. The two outside cups contain 25 pins each; the cup to the immediate left contains 40 washers and the cup to the immediate right of the center contains 20 collars.
Picture: Google Images
The clinician demonstrates and then administers the following 5 subtests:
Right hand (30 seconds): Clients use their right hand to place as many pins as possible down on the row within 30 seconds.
Left hand (30 seconds): Clients use their left hand to place as many pins as possible down on the row within 30 seconds.
Both hands (30 seconds): Clients use both hands simultaneously to place as many pins as possible down both rows.
Right + Left + Both hands: *Please note that this is not an actual test, it is a mathematical sum calculation of the above scores.
Assembly (60 seconds): Clients use both hands simultaneously while assembling pins, washers and collars.
Specific administration instructions can be found in the instruction manual that accompanies the PPT.
Scoring and Score Interpretation:
The clinician compiles 5 separate scores from the complete test procedure, one for each of the following tasks:
Right hand (30 seconds): The total number of pins placed in the right hand column using the right hand in the allotted time.
Left hand (30 seconds): The total number of pins placed in the left hand column using the left hand in the allotted time.
Both hands (30 seconds): The total number of pairs of pins placed in both columns using both hands in the allotted time.
Right + Left + Both hands: The sum of scores for the previous three tasks (right hand + left hand + both hands).
Assembly (60 seconds): The total number of pins, washers and collars assembled in the allotted time.
The testing should commence in the order outlined above, unless the patient is left-handed; tasks 1 and 2 should then be reversed. The preferred method of administration is the three-trial method: the patient should be permitted to attempt three trials for each task after a single demonstration by the clinician. (The one-trial administration method only permits the patient one trial following demonstration by the clinician). The test can be administered in an individual or group setting.
Desrosiers, Hebert, Bravo and Dutil (1995) developed predictive equations for Purdue Pegboard subtest scores, based on normative data resulting from their study. The normative data portion of the study involved 360 healthy participants over the age of 60 years. The following predictive equations were determined:
Purdue subtests
Females
Males
Right hand
24.0 – 0.15 x (age)
22.5 – 0.15 x (age)
Left hand
23.7 – 0.16 x (age)
24.1 – 0.18 x (age)
Both hands
19.9 – 0.14 x (age)
20.0 – 0.15 x (age)
Right + Left + Both hands
67.7 – 0.45 x (age)
66.5 – 0.48 x (age)
Assembly
59.4 – 0.45 x (age)
62.2 – 0.53 x (age)
Example: The expected score for an 80 year old woman on the right hand task is: 24.0 – (0.15 x 80) = 12.
Time:
The PPT takes approximately 5 to 10 minutes to administer and score.
Training requirements:
None typically reported, however it is recommended that the clinician is familiar with the assessment tool. The clinician should be able to demonstrate to clients performance of the PPT at an average speed.
Equipment:
Purdue Pegboard Test (Model #32020)
Instruction manual
One test board
Pins x 50, collars x 20, washers x 40
Score sheets
Testing table approximately 30 inches tall
Stopwatch or clock that reads in seconds
Alternative forms of the Purdue Pegboard Test
None typically reported.
Client suitability
Can be used with:
Clients presenting with lateral brain damage (Costa et al., 1963)
Clients with hemiplegiaComplete paralysis of the arm, leg, and trunk on one side of the body that results from damage to the parts of the brain that control muscle movements. Hemiplegia is not a progressive condition, nor is it a disease. resulting from strokeAlso called a "brain attack" and happens when brain cells die because of inadequate blood flow. 20% of cases are a hemorrhage in the brain caused by a rupture or leakage from a blood vessel. 80% of cases are also know as a "schemic stroke", or the formation of a blood clot in a vessel supplying blood to the brain. (Ashford, Slade, Malaprad & Turner-Stokes, 2008)
Clients requiring assessment for vocational rehabilitation (Hemm and Curtis, 1980)
Clients with dyslexia (Leslie, Davidson and Batey, 1985)
Clients of all ages
Should not be used in:
None reported
In what languages is the measure available?
No formal translations of the PPT have been reported. Because of the non-verbal nature of the assessment it can be used by non-English groups.
Summary
What does the tool measure?
Dexterity and gross movement of the upper limb
What types of clients can the tool be used for?
The PPT can be used with, but is not limited to clients with strokeAlso called a "brain attack" and happens when brain cells die because of inadequate blood flow. 20% of cases are a hemorrhage in the brain caused by a rupture or leakage from a blood vessel. 80% of cases are also know as a "schemic stroke", or the formation of a blood clot in a vessel supplying blood to the brain..
Is this a screeningTesting for disease in people without symptoms. or assessment tool?
Assessment tool
Time to administer
The PPT takes approximately 5 to 10 minutes to administer.
Versions
There are no alternative versions of the PPT.
Other Languages
None typically reported.
Measurement Properties
ReliabilityReliability can be defined in a variety of ways. It is generally understood to be the extent to which a measure is stable or consistent and produces similar results when administered repeatedly. A more technical definition of reliability is that it is the proportion of "true" variation in scores derived from a particular measure. The total variation in any given score may be thought of as consisting of true variation (the variation of interest) and error variation (which includes random error as well as systematic error). True variation is that variation which actually reflects differences in the construct under study, e.g., the actual severity of neurological impairment. Random error refers to "noise" in the scores due to chance factors, e.g., a loud noise distracts a patient thus affecting his performance, which, in turn, affects the score. Systematic error refers to bias that influences scores in a specific direction in a fairly consistent way, e.g., one neurologist in a group tends to rate all patients as being more disabled than do other neurologists in the group. There are many variations on the measurement of reliability including alternate-forms, internal consistency , inter-rater agreement , intra-rater agreement , and test-retest .
Test-retest:
Several studies have investigated the test-retest reliabilityA way of estimating the reliability of a scale in which individuals are administered the same scale on two different occasions and then the two scores are assessed for consistency. This method of evaluating reliability is appropriate only if the phenomenon that the scale measures is known to be stable over the interval between assessments. If the phenomenon being measured fluctuates substantially over time, then the test-retest paradigm may significantly underestimate reliability. In using test-retest reliability, the investigator needs to take into account the possibility of practice effects, which can artificially inflate the estimate of reliability (National Multiple Sclerosis Society). of the PPT in healthy patients and found adequate to excellent test-retest reliabilityA way of estimating the reliability of a scale in which individuals are administered the same scale on two different occasions and then the two scores are assessed for consistency. This method of evaluating reliability is appropriate only if the phenomenon that the scale measures is known to be stable over the interval between assessments. If the phenomenon being measured fluctuates substantially over time, then the test-retest paradigm may significantly underestimate reliability. In using test-retest reliability, the investigator needs to take into account the possibility of practice effects, which can artificially inflate the estimate of reliability (National Multiple Sclerosis Society). for all subtests. A three-trial administration method has been found to be more reliable than a one-trial method.
ValidityThe degree to which an assessment measures what it is supposed to measure.
Construct: Known groups:
One study examined the known groups validityKnown groups validity is a form of construct validation in which the validity is determined by the degree to which an instrument can demonstate different scores for groups know to vary on the variables being measured. of the PPT and found to have 70% accuracy for detecting lateralization of brain damage and 90% accuracy for detecting brain damage regardless of lateralization.
Floor/Ceiling Effects
No studies have examined the floor/ceiling effects of the PPT in clients with strokeAlso called a "brain attack" and happens when brain cells die because of inadequate blood flow. 20% of cases are a hemorrhage in the brain caused by a rupture or leakage from a blood vessel. 80% of cases are also know as a "schemic stroke", or the formation of a blood clot in a vessel supplying blood to the brain..
Does the tool detect change in patients?
No studies have formally investigated the responsivenessThe ability of an instrument to detect clinically important change over time. of the PPT in clients with strokeAlso called a "brain attack" and happens when brain cells die because of inadequate blood flow. 20% of cases are a hemorrhage in the brain caused by a rupture or leakage from a blood vessel. 80% of cases are also know as a "schemic stroke", or the formation of a blood clot in a vessel supplying blood to the brain..
Acceptability
The PPT has been criticized for not being reflective of real life activitiesAs defined by the International Classification of Functioning, Disability and Health, activity is the performance of a task or action by an individual. Activity limitations are difficulties in performance of activities. These are also referred to as function. of daily living (Ashford, Slade, Malaprade & Turner-Stokes, 2008). The test is quick to complete and should not produce undue fatigue for patients.
Feasibility
The PPT is short and easy to administer and score.
How to obtain the tool?
The PPT can be ordered by contacting the manufacturer directly at:
Lafayette Instruments 3700 Sagamore Parkway North P.O. Box 5729 | Lafayette, IN 47903 USA Tel: 765.423.1505 | 800.428.7545 Fax: 765.423.4111 E-mail: info@lafayetteinstrument.com www.lafayetteinstrument.com
Psychometric Properties
Overview
A literature search was conducted to identify all relevant publications on the psychometric properties of the Purdue Pegboard Test (PPT). Several studies have been conducted, however only one study was specific to clients with strokeAlso called a "brain attack" and happens when brain cells die because of inadequate blood flow. 20% of cases are a hemorrhage in the brain caused by a rupture or leakage from a blood vessel. 80% of cases are also know as a "schemic stroke", or the formation of a blood clot in a vessel supplying blood to the brain..
Reliability
Internal consistencyA method of measuring reliability . Internal consistency reflects the extent to which items of a test measure various aspects of the same characteristic and nothing else. Internal consistency coefficients can take on values from 0 to 1. Higher values represent higher levels of internal consistency.: No studies have examined the internal consistencyA method of measuring reliability . Internal consistency reflects the extent to which items of a test measure various aspects of the same characteristic and nothing else. Internal consistency coefficients can take on values from 0 to 1. Higher values represent higher levels of internal consistency. of the PPT in clients with strokeAlso called a "brain attack" and happens when brain cells die because of inadequate blood flow. 20% of cases are a hemorrhage in the brain caused by a rupture or leakage from a blood vessel. 80% of cases are also know as a "schemic stroke", or the formation of a blood clot in a vessel supplying blood to the brain..
Test-retest: Buddenberg and Davis (1999) examined the 1-week test-retest reliabilityA way of estimating the reliability of a scale in which individuals are administered the same scale on two different occasions and then the two scores are assessed for consistency. This method of evaluating reliability is appropriate only if the phenomenon that the scale measures is known to be stable over the interval between assessments. If the phenomenon being measured fluctuates substantially over time, then the test-retest paradigm may significantly underestimate reliability. In using test-retest reliability, the investigator needs to take into account the possibility of practice effects, which can artificially inflate the estimate of reliability (National Multiple Sclerosis Society). of the PPT using the one-trial and three-trial administration procedures, in 47 healthy participants. The three-trial administration method was found to have excellent test-retest reliabilityA way of estimating the reliability of a scale in which individuals are administered the same scale on two different occasions and then the two scores are assessed for consistency. This method of evaluating reliability is appropriate only if the phenomenon that the scale measures is known to be stable over the interval between assessments. If the phenomenon being measured fluctuates substantially over time, then the test-retest paradigm may significantly underestimate reliability. In using test-retest reliability, the investigator needs to take into account the possibility of practice effects, which can artificially inflate the estimate of reliability (National Multiple Sclerosis Society). for all subtests (ICC=0.82, 0.89, 0.85, 0.89 and 0.81 for the right hand, left hand, both hands, R+L+B and assembly subtests respectively). The one-trial administration method was found to have poor to adequate test-retest reliabilityA way of estimating the reliability of a scale in which individuals are administered the same scale on two different occasions and then the two scores are assessed for consistency. This method of evaluating reliability is appropriate only if the phenomenon that the scale measures is known to be stable over the interval between assessments. If the phenomenon being measured fluctuates substantially over time, then the test-retest paradigm may significantly underestimate reliability. In using test-retest reliability, the investigator needs to take into account the possibility of practice effects, which can artificially inflate the estimate of reliability (National Multiple Sclerosis Society). using Interclass CorrelationThe extent to which two or more variables are associated with one another. A correlation can be positive (as one variable increases, the other also increases - for example height and weight typically represent a positive correlation) or negative (as one variable increases, the other decreases - for example as the cost of gasoline goes higher, the number of miles driven decreases. There are a wide variety of methods for measuring correlation including: intraclass correlation coefficients (ICC), the Pearson product-moment correlation coefficient, and the Spearman rank-order correlation. Coefficient (ICC=0.37, 0.61, 0.58, 0.70, 0.51 for the right hand, left hand, both hands, R+L+B and assembly subtests respectively).
Several studies have investigated the test-retest reliabilityA way of estimating the reliability of a scale in which individuals are administered the same scale on two different occasions and then the two scores are assessed for consistency. This method of evaluating reliability is appropriate only if the phenomenon that the scale measures is known to be stable over the interval between assessments. If the phenomenon being measured fluctuates substantially over time, then the test-retest paradigm may significantly underestimate reliability. In using test-retest reliability, the investigator needs to take into account the possibility of practice effects, which can artificially inflate the estimate of reliability (National Multiple Sclerosis Society). of the one-trial administration method of the PPT in healthy participants. The following chart has been adapted from Buddenberg and Davis (1999).
ReliabilityReliability can be defined in a variety of ways. It is generally understood to be the extent to which a measure is stable or consistent and produces similar results when administered repeatedly. A more technical definition of reliability is that it is the proportion of "true" variation in scores derived from a particular measure. The total variation in any given score may be thought of as consisting of true variation (the variation of interest) and error variation (which includes random error as well as systematic error). True variation is that variation which actually reflects differences in the construct under study, e.g., the actual severity of neurological impairment. Random error refers to "noise" in the scores due to chance factors, e.g., a loud noise distracts a patient thus affecting his performance, which, in turn, affects the score. Systematic error refers to bias that influences scores in a specific direction in a fairly consistent way, e.g., one neurologist in a group tends to rate all patients as being more disabled than do other neurologists in the group. There are many variations on the measurement of reliability including alternate-forms, internal consistency , inter-rater agreement , intra-rater agreement , and test-retest . Coefficients Reported for One-Trial Administrations of the Purdue Pegboard Test
Subtests
Tiffin & Asher (1948)
Bass & Stucki (1951)
Tiffin (1968)
Reddon, Gill, Gauk & Maerz (1988) (men/women)
Desrosiers, Bravo & Dutil (1995)
Right hand
0.63
0.67
0.68
0.63/0.76
0.66
Left hand
0.60
0.66
0.65
0.64/0.79
0.66
Both hands
0.68
0.71
0.73
0.67/0.81
0.81
Right + Left + Both hands
0.71
0.79
0.71
NR
0.90
Assembly
0.68
0.72
0.67
0.81/0.83
0.84
NR=not reported
Desrosiers, Hebert, Bravo and Dutil (1995) investigated the test-retest reliabilityA way of estimating the reliability of a scale in which individuals are administered the same scale on two different occasions and then the two scores are assessed for consistency. This method of evaluating reliability is appropriate only if the phenomenon that the scale measures is known to be stable over the interval between assessments. If the phenomenon being measured fluctuates substantially over time, then the test-retest paradigm may significantly underestimate reliability. In using test-retest reliability, the investigator needs to take into account the possibility of practice effects, which can artificially inflate the estimate of reliability (National Multiple Sclerosis Society). of the PPT in 35 healthy individuals aged 60-89 years with no-known upper-limb impairment. Each individual completed the PPT on 2 occasions with approximately 1 week between testing. Test-retest reliabilityA way of estimating the reliability of a scale in which individuals are administered the same scale on two different occasions and then the two scores are assessed for consistency. This method of evaluating reliability is appropriate only if the phenomenon that the scale measures is known to be stable over the interval between assessments. If the phenomenon being measured fluctuates substantially over time, then the test-retest paradigm may significantly underestimate reliability. In using test-retest reliability, the investigator needs to take into account the possibility of practice effects, which can artificially inflate the estimate of reliability (National Multiple Sclerosis Society). , calculated using ICC was found to be adequate to excellent for the 5 subtests (ICC=0.66, 0.83, 0.81, 0.90 and 0.84 for Right hand, Left hand, Both hands, Right+Left+Both hands and Assembly subtests respectively). Scores from the second administration were higher, indicating a practice effect.
Intra-rater: No studies have examined the intra-rater reliabilityThis is a type of reliability assessment in which the same assessment is completed by the same rater on two or more occasions. These different ratings are then compared, generally by means of correlation. Since the same individual is completing both assessments, the rater's subsequent ratings are contaminated by knowledge of earlier ratings. of the PPT in clients with strokeAlso called a "brain attack" and happens when brain cells die because of inadequate blood flow. 20% of cases are a hemorrhage in the brain caused by a rupture or leakage from a blood vessel. 80% of cases are also know as a "schemic stroke", or the formation of a blood clot in a vessel supplying blood to the brain..
Inter-rater: No studies have examined the inter-rater reliabilityA method of measuring reliability . Inter-rater reliability determines the extent to which two or more raters obtain the same result when using the same instrument to measure a concept. of the PPT in clients with strokeAlso called a "brain attack" and happens when brain cells die because of inadequate blood flow. 20% of cases are a hemorrhage in the brain caused by a rupture or leakage from a blood vessel. 80% of cases are also know as a "schemic stroke", or the formation of a blood clot in a vessel supplying blood to the brain..
Validity
Content:
No studies have examined the content validityRefers to the extent to which a measure represents all aspects of a given social concept. Example: A depression scale may lack content validity if it only assesses the affective dimension of depression but fails to take into account the behavioral dimension. of the PPT in clients with strokeAlso called a "brain attack" and happens when brain cells die because of inadequate blood flow. 20% of cases are a hemorrhage in the brain caused by a rupture or leakage from a blood vessel. 80% of cases are also know as a "schemic stroke", or the formation of a blood clot in a vessel supplying blood to the brain..
Criterion:
Concurrent: No studies have examined the concurrent validityTo validate a new measure, the results of the measure are compared to the results of the gold standard obtained at approximately the same point in time (concurrently), so they both reflect the same construct. This approach is useful in situations when a new or untested tool is potentially more efficient, easier to administer, more practical, or safer than another more established method and is being proposed as an alternative instrument. See also "gold standard." of the PPT in clients with strokeAlso called a "brain attack" and happens when brain cells die because of inadequate blood flow. 20% of cases are a hemorrhage in the brain caused by a rupture or leakage from a blood vessel. 80% of cases are also know as a "schemic stroke", or the formation of a blood clot in a vessel supplying blood to the brain..
Predictive: No studies have examined the predictive validityA form of criterion validity that examines a measure's ability to predict some subsequent event. Example: can the Berg Balance Scale predict falls over the following 6 weeks? The criterion standard in this example would be whether the patient fell over the next 6 weeks. of the PPT in clients with strokeAlso called a "brain attack" and happens when brain cells die because of inadequate blood flow. 20% of cases are a hemorrhage in the brain caused by a rupture or leakage from a blood vessel. 80% of cases are also know as a "schemic stroke", or the formation of a blood clot in a vessel supplying blood to the brain..
Construct:
Convergent/Discriminant: No studies have examined the convergent or discriminant validityMeasures that should not be related are not. Discriminant validity examines the extent to which a measure correlates with measures of attributes that are different from the attribute the measure is intended to assess. of the PPT in clients with strokeAlso called a "brain attack" and happens when brain cells die because of inadequate blood flow. 20% of cases are a hemorrhage in the brain caused by a rupture or leakage from a blood vessel. 80% of cases are also know as a "schemic stroke", or the formation of a blood clot in a vessel supplying blood to the brain..
Known Groups: Costa, Vaughan, Levita & Farber (1963) examined the known groups validityKnown groups validity is a form of construct validation in which the validity is determined by the degree to which an instrument can demonstate different scores for groups know to vary on the variables being measured. of Purdue Pegboard subtests (Right, Left and Both hands) in 54 clients with brain damage resulting from neoplasms, traumatic injury or degenerative, vascular or infectious diseases; and 26 clients with peripheral nervous system lesions or lesions below the level of the thoracic spine (control group). Clinical neurological examination, electroencephalography and neuroradiographic procedures were used to confirm diagnosis. The PPT accurately identified clients below the age of 60 years as having brain damage if one or more of the following were found on scoring: left score < 11; right score < 13; both hands score < 10; or left score > right score +3; and a lesion on the left if left score > right score, and on the right if right score > left score + 3. The PPT accurately identified clients above the age of 60 years as having brain damage if one or more of the following were found on scoring: left score < 10; right score < 10; both hands score < 8; or left > right +3; and a lesion on the left if left > right, and on the right if right > left + 3. If the client’s scores accurately classified the client as having brain damage but neither left or right lesions were identified based on the scores, the brain damage is categoried as bilateral. The above PPT cutoff scores were found to have a 70 percent accuracy for lateralization and a 90 percent accuracy for brain damage without regard to lateralization.
Sensitivity/specificity:
No studies have examined the sensitivitySensitivity refers to the probability that a diagnostic technique will detect a particular disease or condition when it does indeed exist in a patient (National Multiple Sclerosis Society). See also "Specificity." /specificity of the PPT in clients with strokeAlso called a "brain attack" and happens when brain cells die because of inadequate blood flow. 20% of cases are a hemorrhage in the brain caused by a rupture or leakage from a blood vessel. 80% of cases are also know as a "schemic stroke", or the formation of a blood clot in a vessel supplying blood to the brain..
Responsiveness
No studies have examined the responsivenessThe ability of an instrument to detect clinically important change over time. of the PPT in clients with strokeAlso called a "brain attack" and happens when brain cells die because of inadequate blood flow. 20% of cases are a hemorrhage in the brain caused by a rupture or leakage from a blood vessel. 80% of cases are also know as a "schemic stroke", or the formation of a blood clot in a vessel supplying blood to the brain..
References
Ashford, S., Slade, M., Malaprade, F., Turner-Stokes, L. (2008). Evaluation of functional outcome measures for the hemiparetic upper limb: A systematic review. Journal of Rehabilitation Medicine, 40, 787-795
Buddenberg, L.A. & Davis, C. (1999). Test-retest reliability of the Purdue Pegboard Test. The American Journal of Occupational Therapy, 54(5), 555-558
Costa, L.D., Vaughan, H.G., Levita, E. & Farber, N. (1963). Purdue Pegboard as a predictor of the presence and laterality of cerebral lesions. Journal of Consulting Psychology, 27(2), 133-137
Desrosiers, J., Hebert, R, Bravo, G. and Dutil, E. (1995). The Purdue Pegboard Test: Normative data for people aged 60 and over. Disability and Rehabilitation, 17(5), 217-224
See the measure
How to obtain the Purdue Pegboard Test?
The PPT can be ordered by contacting the manufacturer directly at:
Lafayette Instruments
3700 Sagamore Parkway North
P.O. Box 5729 | Lafayette, IN 47903 USA
Tel: 765.423.1505 | 800.428.7545
Fax: 765.423.4111
E-mail: info@lafayetteinstrument.com
Web: www.lafayetteinstrument.com
To provide the best experiences, we use technologies like cookies to store and/or access device information. Consenting to these technologies will allow us to process data such as browsing behavior or unique IDs on this site. Not consenting or withdrawing consent, may adversely affect certain features and functions.
Functional
Always active
The technical storage or access is strictly necessary for the legitimate purpose of enabling the use of a specific service explicitly requested by the subscriber or user, or for the sole purpose of carrying out the transmission of a communication over an electronic communications network.
Preferences
The technical storage or access is necessary for the legitimate purpose of storing preferences that are not requested by the subscriber or user.
Statistics
The technical storage or access that is used exclusively for statistical purposes.The technical storage or access that is used exclusively for anonymous statistical purposes. Without a subpoena, voluntary compliance on the part of your Internet Service Provider, or additional records from a third party, information stored or retrieved for this purpose alone cannot usually be used to identify you.
Marketing
The technical storage or access is required to create user profiles to send advertising, or to track the user on a website or across several websites for similar marketing purposes.